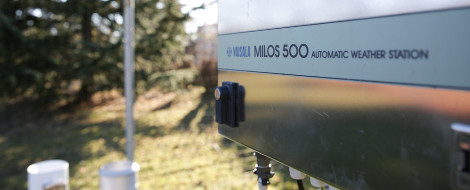


Automated weather station
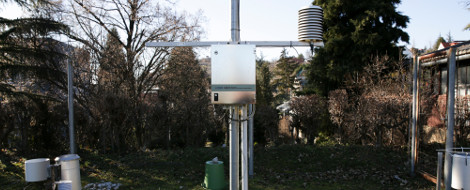
The core of the automated weather station was manufactured by the Finnish VAISALA company, although some of the devices were manufactured by companies Lambrecht GmbH and OTT GmbH. The station itself is located in the Ifjúság Street campus of University of Pécs. The station has been collecting weather data since November 2008.
All measurements at the station are fully automated. The station logs temperature (air and soil at depths of 5, 10 and 20 cm), relative humidity, air pressure (station level, equipment level, and sea level), precipitation totals, precipitation intensity, wind direction, wind speed, global radiation and leaf wetness data in 1-minute intervals.
Temperature, dew point and relative humidity measurments
Temperature, one of the most essential meteorological parameters, is measured by a platina thermometer. The platina plate's electrical resistance depends only on ambient temperature, and the resistance is measured with high precision and converted to temperature by a pre-determined functional relationship. The air temperature sensor is positioned at a height of 2 meters while soil temperature is measured at depths of 5, 10, and 20 centimeters. The temperature sensor also provides relative humidity values. Based on air temperature and relative humidity multiple parameters are calculated, including dew point temperature and vapor deficit. Dew point is given by a simple relationship using relative humidity and air temperature data, with an accuracy of around 1oC (when relative humidity exceeds 30%):
| Td=Ta— | 100 - hr 5 |
, where Ta is the actual air temperature in Celsius, Td the dew point temperature. According to a simple relationship there is a 5 percent decrease for every 1oC increase between the actual temperature and the dew point temperature (the approximation is not exactly precise, particularly at low humidity, see fig 1.). There are more precise but rather complicated relationships between air temperature and hr, for example the modified form of the Tetens' formula (detailed information e.g.: Campbell, 1998):
| Td= |
| |||||||||
, where ea is the actual vapor pressure, a, b and c are constants, in the case of water a = 0.611, b = 17.502, c = 240.97.
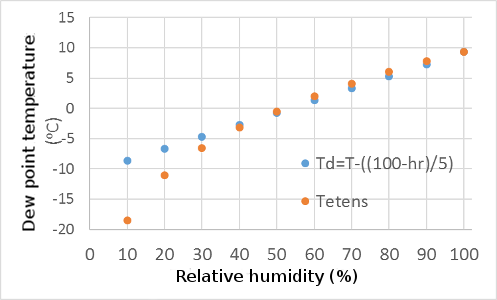
Figure 1. Dew point temperature calculated as a function of relative humidity at an air temperature of 9.3oC
Increasing differences between the dew point temperatures measured by the two methods are observed with increasing air temperatures (Figure 2).
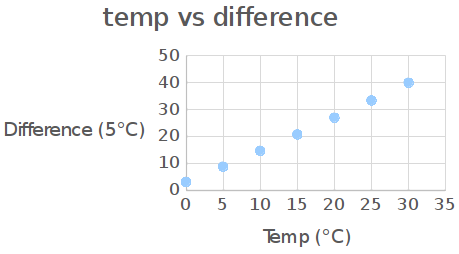
Figure 2. Differences between the dew point temperatures measured by the two methods as a function of ambient air temperature
Air pressure sensor
The weather station is also equipped with a barometer. By knowing the air temperature, the program calculates the sea-level air pressure by the following equation:
, where p1 and p2 are the air pressure measured at the observation point (p2) and the point of interest (p2) in hPa, h is the height of the observation point (above sea level), Tm is the average temperature of the observation point and the point of interest. Sea level temperature is calculated with the following equation assuming a temperature drop of 0.65oC over an altitude increment of 100 meters:
| T1 = T2+ |
|
There is only a very little pressure difference between pressure measured at ground level and in the sensor (positioned 2 meters above ground surface): essentially it corresponds to an elevation difference of only 2 meters and a pressure difference of 0.2 hPa. Air pressure decreases with increasing height in an exponential fashion. Pressure (kPa) values at a given elevation is calculated with the following equation:
Pa=101.325 e |
|
On the summit of Mount Everest (8,848 m) a pressure of about 34 kPa is measured, while at sea level the approximate pressure value is 101.325 kPa.
Precipitation
Precipitation is measured with multiple methods at the weather station of UP. We use manual, tipping-bucket and weighing rain gages while measurements are also taken by a disdrometer.
Wind speed, wind direction
Speed is measured by a cup anemometer that counts the number of rotations.
The minimum measurement limit is 0.1m/s, while the maximum measurable wind velocity is 50 m/s.
A wind vane is used to determine wind direction with a resolution of 2.5o.
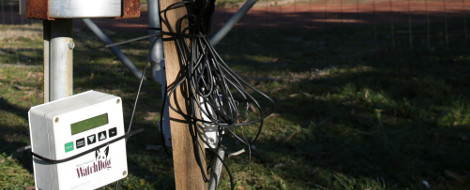
Leaf wetness
This sensor measures the interval while the leaves covered by dew. This information is important for controlling fungi infection.
Solar radiation
Solar radiation is the sum of radiations coming from the space above horizon. Sun's direct radiation, and the diffused radiation from sky. The unit of the sensor is W/m2.
OTT Parsivel2 - laser-optical disdrometer
Introduction:
OTT Parsivel2 is a laser-based optical instrument, which can detect
all types of precipitation.
The liquid particles (water drops) can be measured in the size interval
of 0.2 - 8 mm, the solid particles (e.g. snowflakes, snow grains,
hail particles) can be measured in the size interval of 0.2 - 25 mm.
The fall speed of particles can be observed between 0.2 - 20 m/s.
The following precipitation types can be distinguished by the measured size and
velocities:
- (1) drizzle;
- (2) drizzle and rain;
- (3) rain;
- (4) rain, drizzle and snow;
- (5) snow;
- (6) sleet;
- (7) graupel;
- (8) hail
The measurements are made by a special sensor head. The device based on an optical principle, it emits light as it is explained in the following picture.
Measurement of the size of the particles:
If no particle passes through the laser beam, the maximum voltage is measured by the receiver. When falling particles reach the laser beam, they block certain part of the beam depending on their diameters and the shadow caused by the particles reduces the output voltage. The size of the particles can be calculated from these values.
Measurement of particle speed:
The sensor measures the duration of the signal, which is generated during the time the particles fall through the beam.
The following parameters can be evaluated from the size and the speed of particle: (1) size spectrum; (2) type of precipitation; (3) kinetic energy of particles; (4) intensity of precipitation; (5) radar reflectivity (6) visibility.
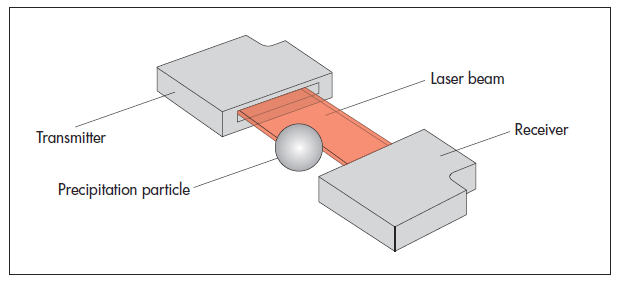
Figure 3. OTT Parsivel2 laser sensor operating principle. Source of figure: OTT Parsivel2 manual
OTT Pluvio2 L - precipitation gauge
Introduction:
The precipitation gauge automatically determines the intensity of precipitation and the amount of precipitation. The measurements are based on the weighing principle.
The device detects the amount of precipitation (whether it is liquid or solid) by measuring the weight of the collecting bucket.
A high precision, stainless steel load cell is used as a sensor element, which is separated from the environmental influences, and a built-in temperature sensor which compensates for the
temperature changes in the weighing mechanism.
In every 6th second, the device measures the weight of the collecting bucket with a resolution of 0.001 mm (=raw data). The difference between the measured value and the basic weight of the empty
collecting bucket gives the current amount of precipitation in the bucket. From the difference of the measured heights at two the intensity of precipitation can be calculated in the unit of mm/min
or in the unit of mm/h. The accumulated precipitation for a longer time period can be calculated by summarizing the precipitations.
Data can be displayed as real-time or as non-real-time data.
Real-time output (RT): after the onset of a precipitation event, if the measured intensity is greater than 0.1 mm/h, the measured values are displayed within a minute. Advantage: fast response time
and reliable intensity value.
Non-real-time output (NRT): the result of the measurement is displayed 5 minutes after the onset of the precipitation event. Advantage: accurate precise intensity.
The device provides the measured precipitation values with resolution of 0.01 mm.
CHM 15k Nimbus - ceilometer
CHM 15k Nimbus is a ceilometer which is based on Lidar (Light detection and ranging) technique. It emits radiation at wavelength of near infrared by short pulses in upward direction.
The emitted light is scattered back by aerosol particles and air molecules present in the atmosphere. The pulse flight time and the intensity of the backscattered signal are observed.
The different heights of the cloud- and aerosol layers, the cloud penetration depth, and the horizontal visibility can be evaluated from the backscattered energy.
Besides these values, the software determines the sky condition index: (1) no fog nor precipitation detected; (2) rain; (3) fog; (4) snow or freezing rain.
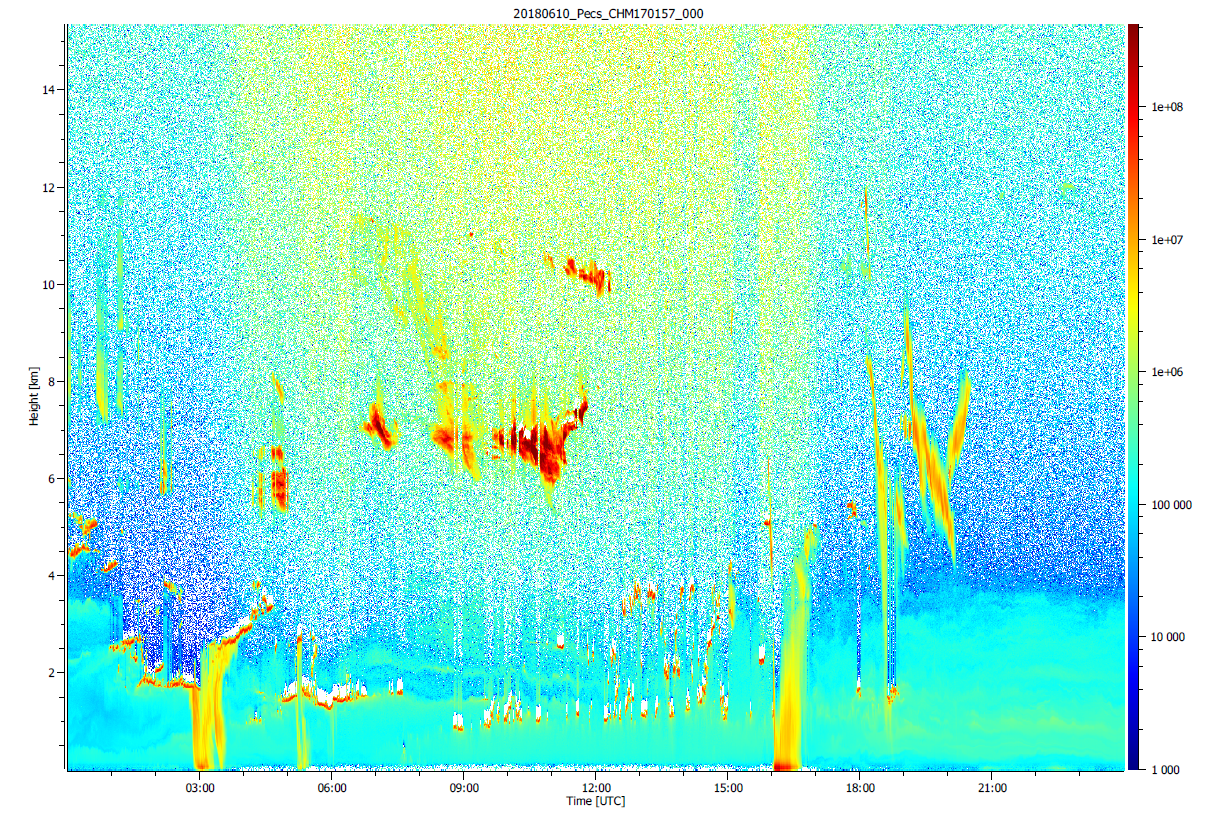
Figure 4. An example of a vertical profile observed by the ceilometer. The scale in the right side shows the backscattering cross section in the unit of m-1sr-1.
Data collection and storage
A computer periodically downloads data from the measuring station and writes them to a database. Users can access data from the database. The station also communicates with the Hungarian Meteorological Service, hence all data also imported to the national weather network.
Interesting facts
To this day (April 19, 2017) even if not corresponds to our station,
but corresponds to Pécs, the record of the highest daily minimal temperature in Hungary,
27.9 oC, which was measured on July 20, 2007, at the weather station at Pécs-Árpádtetõ (NE Pécs).
(http://owww.met.hu/eghajlat/Magyarorszag/rekordok/).
At that time our weather station was not working yet, we have more or less continuous data series only since November 2008.
Further reading
Campbell, G. S. (1998): Environmental Biophysics. 2nd ed. Springer-Verlag New York Inc.
Access levels
The server provides these webpages, with different access levels,
some content could be accessed only with valid username/password combination,
or from the internal net of the faculty.
Contacts
- get access to password protected data: sczigany@gamma.ttk.pte.hu.
- technical questions: carlos@ttk.pte.hu.
Coordinates of the weather station:
Latitude: N46.077666
Longitude: E18.207135
altitude: 174m (above the Baltic Sea)